Как отслеживать использование памяти CPU и загруженность диска в Java
В этой статье, мы обсудим некоторые начальные команды, инструменты и методы, которые помогут отслеживать использование памяти CPU и загруженность диска в Java.
Java инструменты наблюдают за конструкциями и процессами байткода Java. Профайлеры Java следят за всеми системными командами и использованием процессора. Это позволяет вам вызвать средства в любой момент.
Стандартный профайлер предоставляет большой объем знаний, ценность которых зависит от назначения отладки. Некоторые инструменты лучше для объединения логов для всех приложений и серверов, таких как Stackify Retrace, настраивая и отслеживая автоматический лог запросов. Инструменты: Stackify’s Application Performance Management, Retrace — предлагают Java пользователям лучшее понимание устройства приложения при помощи внедренного логирования и профилирования кода. Вместе с внедренным централизованным и структурированным логированием, можно получить доступ ко всем логам приложения из единой точки для всех приложений и серверов.
Здесь мы перечислили способы демонстрации памяти и отслеживания CPU в Java для оптимизации кода.
5 способов для наблюдения за памятью CPU и загруженностью диска в Java!
- Базовые Linux команды для отслеживания использования памяти CPU и загруженности диска a)free –m Команда передает доступную и занятую память вашей виртуальной машины. b)top Эта команда для просмотра использования CPU и памяти.
 Когда вы введете 1 на клавиатуре, тогда topсработает и отобразит все возможные CPU и использование каждого. Всего 4 CPU — CPU0, CPU1, CPU2, CPU3 — и вся их статистика использования. c)meminfo и cpuinfo Используйте следующие команды для детальной информации относительно памяти и процессоров виртуальной машины. $cat /proc/cpuinfo$cat /proc/meminfo d) Память CPU и использование диска конкретного процесса. $ps -p [pid] -o %cpu,%mem,cmdЭта команда для отслеживания использования CPU и загруженности памяти методом приложения Java. Также отображает какие команды запустили процесс. e) Это статистика потока Java метода. $ps uH –p [pid] Эта команда предоставляет число потоков в процессе и их статистику. Это показывает как много памяти и CPU использовано для каждой угрозы и как долго они работают. Когда приложение не отвечает, эти команды могут использоваться для выполнения предыдущих запросов, прежде чем переходить к памяти и дырам в потоках. Это важные команды для первоначального исследования кроме статистики памяти и CPU. df –k –> Для проверки места на диске lsof -i : –> Для проверки, является ли данный порт открытым lsof –i: tcp –> Все установленные и слушающие TCP подключения netstat -plunt –> Подключение к сети
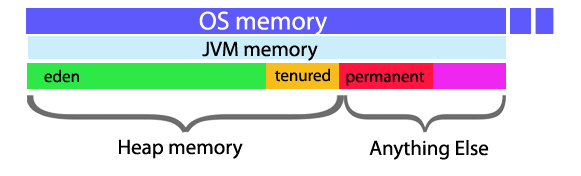
 - Отслеживание использования памяти Далее рассмотрим класс ManagementFactory для отслеживания использования памяти. Это реализовано путем запроса к MemoryMXBean. Раздел памяти куча необходим для использования MemoryMXBean:
 Когда вы введете 1 на клавиатуре, тогда topсработает и отобразит все возможные CPU и использование каждого. Всего 4 CPU — CPU0, CPU1, CPU2, CPU3 — и вся их статистика использования.
  c)meminfo и cpuinfo Используйте следующие команды для детальной информации относительно памяти и процессоров виртуальной машины. $cat /proc/cpuinfo$cat /proc/meminfo d) Память CPU и использование диска конкретного процесса. $ps -p [pid] -o %cpu,%mem,cmd
 Эта команда для отслеживания использования CPU и загруженности памяти методом приложения Java. Также отображает какие команды запустили процесс. e) Это статистика потока Java метода. $ps uH –p [pid] Эта команда предоставляет число потоков в процессе и их статистику.
  Это показывает как много памяти и CPU использовано для каждой угрозы и как долго они работают. Когда приложение не отвечает, эти команды могут использоваться для выполнения предыдущих запросов, прежде чем переходить к памяти и дырам в потоках. Это важные команды для первоначального исследования кроме статистики памяти и CPU. df –k –> Для проверки места на диске lsof -i : –> Для проверки, является ли данный порт открытым lsof –i: tcp –> Все установленные и слушающие TCP подключения netstat -plunt –> Подключение к сети
MemoryMXBean memoryMXBean = ManagementFactory.getMemoryMXBean(); System.out.println(String.format(“Initial memory: %.2f GB”, (double)memoryMXBean.getHeapMemoryUsage().getInit() /1073741824)); System.out.println(String.format(“Used heap memory: %.2f GB”, (double)memoryMXBean.getHeapMemoryUsage().getUsed() /1073741824)); System.out.println(String.format(“Max heap memory: %.2f GB”, (double)memoryMXBean.getHeapMemoryUsage().getMax() /1073741824)); System.out.println(String.format(“Committed memory: %.2f GB”, (double)memoryMXBean.getHeapMemoryUsage().getCommitted() /1073741824));How to find Java Heap Size and Memory Used (Linux)?
To find the Java heap size and the amount of memory used on a Linux system, you can use the jstat command and specify the process ID (PID) of the Java process.
Here is an example of how to do this:
This will display the Java heap size and the amount of memory used, as well as other information about the garbage collector.
Alternatively, you can use the jmap command to get a detailed memory map of the Java process. Here is an example:
This will display the size and usage of the different memory regions in the Java heap, as well as the number of objects and the amount of memory used in each region.
You can find the PID of the Java process by using the ps command and looking for the process that is running the Java executable. For example:
This will list all processes that have «java» in their command line, along with the PID of each process.
You can also use the top command to find the PID of the Java process. The top command will display a list of all running processes, along with the PID, the CPU and memory usage, and the command line of each process. You can use the top command to find the Java process and its PID.
To get the total Java heap size, you can use the -XX:+PrintFlagsFinal option with the java command and search for the MaxHeapSize flag. For example:
java -XX:+PrintFlagsFinal -version | grep MaxHeapSizeThis will print the value of the MaxHeapSize flag, which is the maximum heap size that can be used by the Java process.
Keep in mind that these commands will only work if the Java process was started with the jstat , jmap , or java commands, and if you have permission to run these commands on the system.
Java Runtime: Get Free, Used and Total Memory in Java
Although Java provides automatic garbage collection, sometimes you will want to know how large the object heap is and how much of it is left. You can use this information, for example, to check your code for efficiency or to approximate how many more objects of a certain type can be instantiated. To obtain these values, use the totalMemory( ) and freeMemory( ) methods.
The java.lang.Runtime.totalMemory() method returns the total amount of memory in the Java virtual machine. The value returned by this method may vary over time, depending on the host environment. Note that the amount of memory required to hold an object of any given type may be implementation-dependent.
package com.crunchify.tutorials; /** * @author Crunchify.com */ public class CrunchifyJVMParameters < public static void main(String[] args) < int mb = 1024 * 1024; // get Runtime instance Runtime instance = Runtime.getRuntime(); System.out.println("***** Heap utilization statistics [MB] *****\n"); // available memory System.out.println("Total Memory: " + instance.totalMemory() / mb); // free memory System.out.println("Free Memory: " + instance.freeMemory() / mb); // used memory System.out.println("Used Memory: " + (instance.totalMemory() - instance.freeMemory()) / mb); // Maximum available memory System.out.println("Max Memory: " + instance.maxMemory() / mb); >> ##### Heap utilization statistics [MB] ##### Total Memory: 71 Free Memory: 70 Used Memory: 0 Max Memory: 1061
If you liked this article, then please share it on social media. Have a question or suggestion? Please leave a comment to start the discussion.